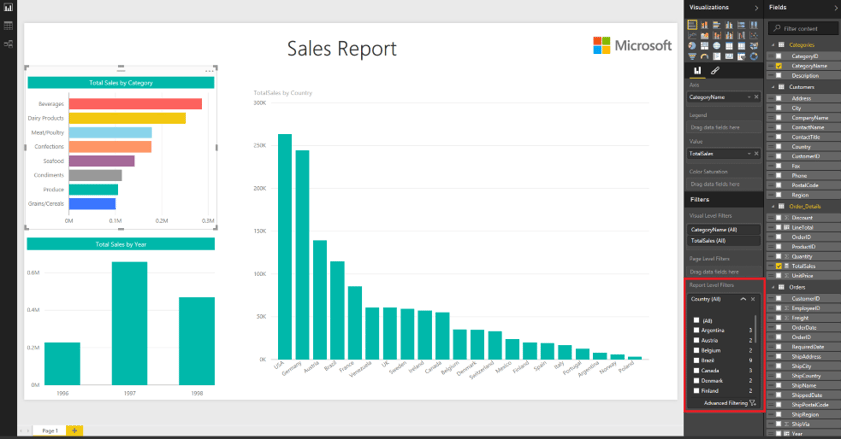
In doing analysis you will often need to create an “exception filter” for when you want to select everything except for specific values (i.e “exceptions”). However, filters are designed to select what you want to include, and not the other way around. It can be quite tedious to do exception filtering when there are several items to choose from.
In this article we discuss how we can enable exception filtering in Microsoft Power BI.
SCENARIO
Imagine a scenario where a Sales Director is trying to analyze sales performance across Southeast Asia, but wants to exclude Singapore data. In the example below, type M represents the Singapore data.

If we were to create a slicer for the "Type" column, the transactions for each Type would be as follows:
- Type L (8 rows)
- Type D (9 row)
- Type M (1 row)
What if you wanted to view your sales data in two ways:
Context 1. View all sales across all countries in Southeast Asia, meaning we include all Types (12 rows)
Context 2. View all sales across all countries in Southeast Asia EXCEPT Singapore or Type M (11 rows)
For this, we will create a slicer called 'Exclude Special' with values as follows:
- Exclude Special = No: for Context 1
- Exclude Special = Yes : for Context 2
SOLUTION
1. Create the slicer "Exclude Special" in a new table.

2. Create a New Amount field based on the original "Amount" field above, where:
New Amount =
IF (
HASONEVALUE('Exclude Special'[Exclude Special])
, SWITCH
(
VALUES('Exclude Special'[Exclude Special])
,"Yes", CALCULATE ([Amount], 'Fact - Transaction'[Type] <> "M")
,"No", CALCULATE ([Amount])
),0)
RESULT
Now you have a new filter that allows you to easily exclude Singapore sales data simply by selecting “Yes” or “No” under the “Exclude Special” slicer.


CONCLUSION
This is a simple solution for creating a single exclusion filter. However, it may not be practical when there are too many metrics, because we have to create a new exclusion filter for each metric. This will require extra control to develop and maintain.


