One of the common requests I have found on the BOB board relates to how can we link WEBI/CR reports with XCelsius dashboards. The common scenario is where we are showing some summary information in an XCelsius dashboard and I want to show some related detailed report using WEBI or CR on the same dashboard.
In BusinessObjects Enterprise XI 3.1, Edge XI 3.1 and Crystal Reports Server 2008 v1, the new Interportlet Communication (IPC) feature in Dashboard Builder allows the transfer of information between distinct analytics. Now you can pass parameters from an Xcelsius dashboard to another XCelsius dashboard or to Crystal Reports and Web Intelligence. Using this framework, I will show 2 simple ways to link between:
- Two XCelsius dashboards
- Between an XCelsius dashboard and Web Intelligence/Crystal Reports
XCelsius to XCelsius linking
An XCelsius dashboard used as a source document has to be configured with a Portal Provider Connection. The target analytic also has to be configured with the Portal Consumer Connection. We will send parameter data between two analytics with the use of a simple example: sending information from a list box selector in one analytic to drive a chart in another dashboard. The steps are
Create the provider analytic
1. Create the list box control for the years: As you can see below I have created a simple list box control with the years.
The selected item from the list box is placed in cell B2 in my example (marked in yellow). I have also set the size of the canvas to fit the component.
2. Create a new portal data connection as shown below.
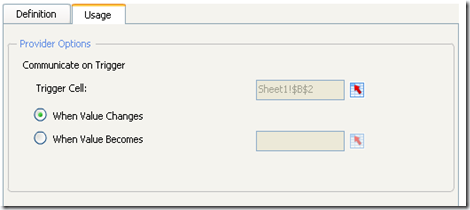
Choose provider as the Connection Type and give a name to the range (in my example Year). Since we are passing a single cell of data, select Cell as the range type and the cell B2 which is the target of the list box selection. Also go to the usage tab and instruct the data connection to communicate with the consumers when the value in the target cell (B2) changes.
This will ensure that whenever the user makes any selection on the list box, the label will be passed to the target/consumer of the portal connection.
Create the target analytic
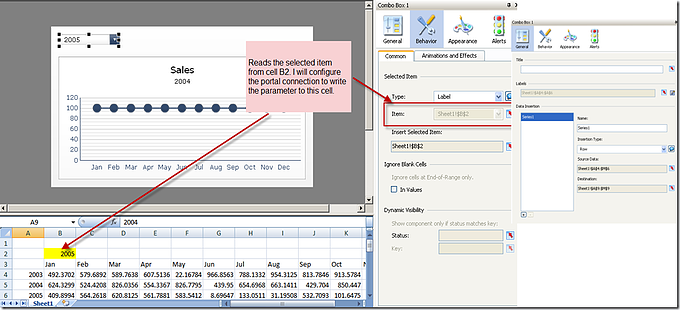
1. In the target dashboard I have created a simple dashboard where I have a chart combo box.
In the properties of the combo box I have set the combo to read the current selection from a cell. When the selection in the cell changes it will read the row of the data corresponding to the selected year and place it in the target row which drives the chart.
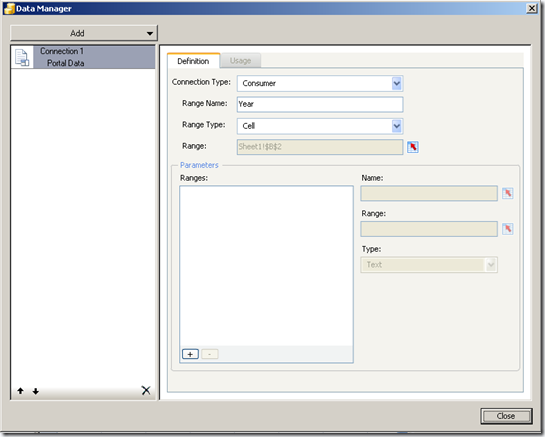
2. Define the portal data connection of type consumer as shown below.
Keep in mind that the Range name has to be the same for both the provider and the consumer. Also since the provider is going to pass a single cell I have selected the range type as Cell and have it update cell B2 which drives my drop down and chart.
Combine them in the dashboard
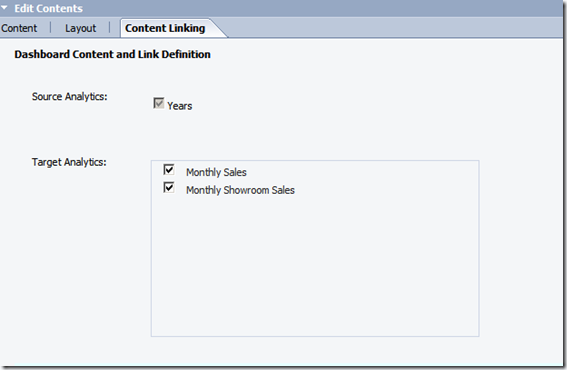
Now log on to InfoView and create a new Corporate Dashboard. Drag your Provider and Consumer analytics onto the dashboard. Also activate Content Linking. This can be done by setting the properties of the Provider analytic. Choose the Provider analytic as the Source Analytics, and Consumer as the Target Analytics as shown below.
XCelsius to WEBI/CR linking
An XCelsius dashboard used as a source document for Crystal Reports and Web Intelligence has to be configured with the FS Command connectivity. The parameters are then assembled in an OpenDocument URL by the Dashboard Builder framework. For more information about the OpenDocument syntax, see the documentation:
http://help.sap.com/businessobject/product_guides/boexir31/en/xi3-1_url_reporting_opendocument_en.pdf
To illustrate this example I have a summary report in XCelsius and use WEBI to show the detailed month wise breakdown.
Create the provider analytic
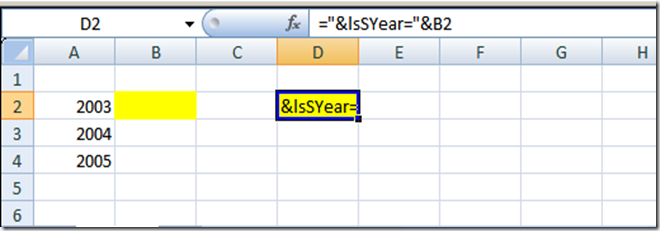
The steps to create the provider are the same. In fact I have used the same analytic that I used in the previous example. The only difference is that since the dashboard builder framework uses the OpenDoc URL format to pass the parameters I need to massage the parameter so that it can sent to WEBI as shown below.
In cell D2, I take the selection from B2 and use excel formula (="&lsSYear="&B2) to create the parameter for the data connection.
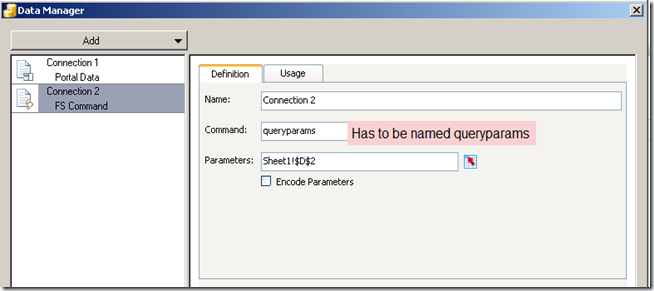
Now go to the data connections and add a new FS Data connection as shown below.
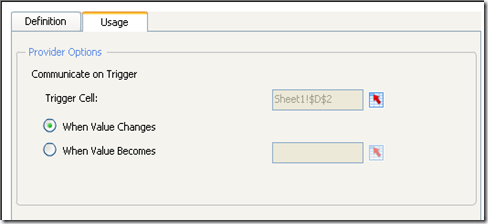
The trigger also has to be set in the usage tab, so that the data connection sends the new value whenever the value in the cell D2 changes.
Now export this to SWF and save it in the infoview portal.
Create the WEBI Report
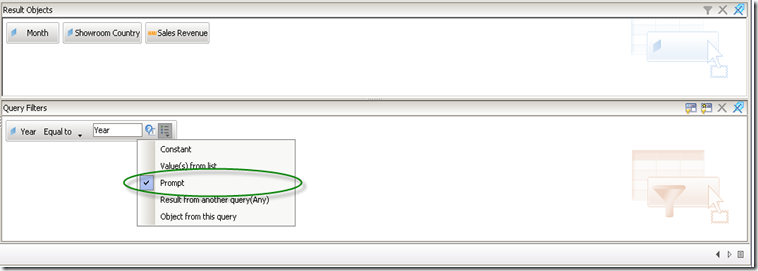
The steps to create the WEBI Report is fairly simple. As shown below I have created a simple WEBI report which takes in the year as the prompt.
The only thing to keep in mind is the name of the prompt should correspond to the formula set in the provider analytic. For example in my case the open doc param formula in the provider analytics is ="&lsSYear="&B2 which corresponds to the Year prompt in WEBI.
Save WEBI report in the infoview portal and test the content linking as shown earlier.
If you want more details you can check out the user guides at
OpenDocument User Guide: http://help.sap.com/businessobject/product_guides/boexir31/en/xi3-1_url_reporting_opendocument_en.pdf
Dashboard Builder User Guide: http://help.sap.com/businessobject/product_guides/boexir31SP3/en/xi31_sp3_dashboard_user_en.pdf


