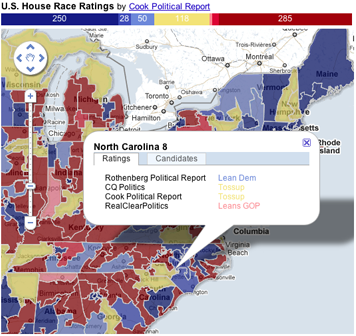
Oracle Fusion Middleware MapViewer is a development toolkit for incorporating interactive maps and spatial analyses. It is optimized for use with Oracle Spatial and Graph. In this post we will discuss how we can use the API toolkit from Mapviewer to create interactive map based analytics.
The objective of the document provides step-by-step instructions to create examples that use MapViewer’s HTML5 based JavaScript API within Oracle Business Intelligence Enterprise Edition (OBIEE). For example lasso selection of POIs allows the user to select a set of POI's and can be used to trigger a custom function that highlights the selected section and also displaying the names of the selected POIs on the right.
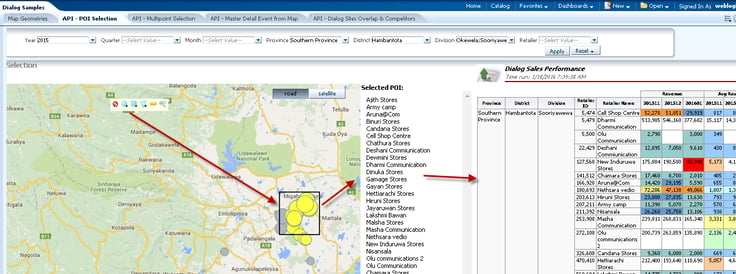
This example above showcases a draggable map toolbar with multiple control buttons. Each button is an Oracle Maps built-in tool (such as the Circle, Rectangle, Redline/Polygon, Distance and Marquee zoom tool). Creating the answers request to achieve this is quite simple. All you really need to do is to create an answers request and use the javascript in the narrative view with the required mapviewer API. For example we can select a set of columns from the subject area as shown below.
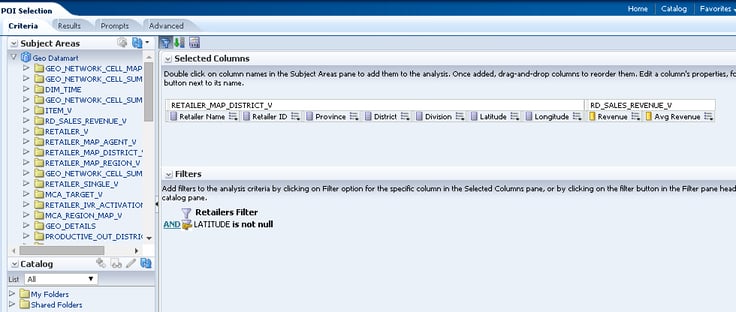
In this example we are selecting the retailer, its sales and latitude and longitude for the retail location from the OBIEE business model. Once done we can go ahead and setup the javascript in the narrative view as shown below.
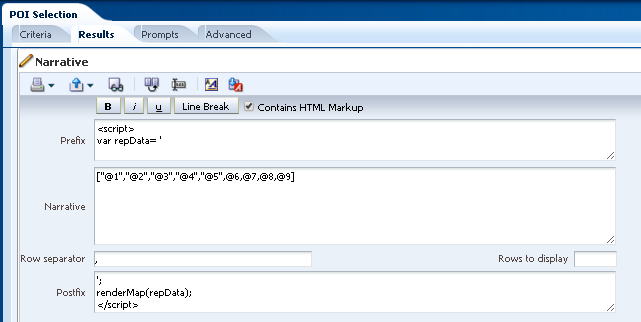
The answers request is only calling a javascript function called renderMap with the values returned by the answers request. The trick of course is in the entire javascript which is embedded on the dashboard where this function is defined.
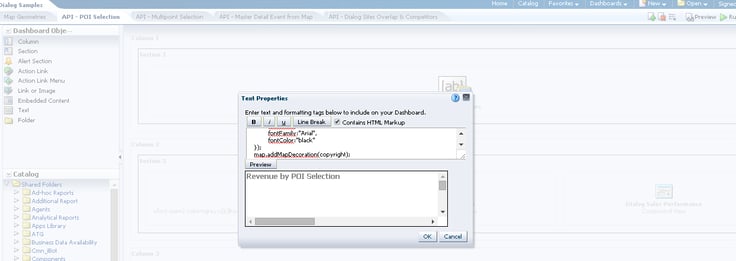
For the lasso selection example shown above the entire javascript code is provided below for reference.
/* Javascript code to be embedded in the dashboard page */
<font size=2 color=grey>[b]Revenue by POI Selection[/b]</font><br/><br/>
<table><tr>
<td><DIV id='map' style="width:800px;height:600px;padding:10px;"></DIV></td>
<td valign='top'> <br/><b>Selected POI:</b><br/>
<DIV id='selectedpois' style="width:200px;height:600px;padding:10px;overflow-y: scroll;"></DIV></td>
</tr></table>
<script src="http://maps.google.com/maps/api/js?sensor=false"></script>
<script src='/mapviewer/jslib/v2/oraclemapsv2.js'></script>
<script>
var map, poiLayer, highlightLayer;
var currMapData = "";
var highlights=[];
/*SAutils JS Library*/
var SAutils = SAutils || {};
SAutils.getxmldoc=function(xmltext){
if (window.DOMParser) {
parser=new DOMParser();
xmlDoc=parser.parseFromString(xmltext,"text/xml");
} else {
xmlDoc=new ActiveXObject("Microsoft.XMLDOM");
xmlDoc.async=false;
xmlDoc.loadXML(xmltext);
}
return xmlDoc;
}
SAutils.getVarPromptInfo=function(varname){
collections= gDocPromptManager.getAllPromptCollectionJSON();
for(i=0;i<collections.length;i++){
c=collections[i];
for (j=0;j<c.promptSteps.length;j++){
pstep=c.promptSteps[j];
for (k=0;k<pstep.prompts.length;k++){
p=pstep.prompts[k];
if(p.promptType=="variablePrompt"){
if (p.attributes.setVariableName.indexOf("['" + varname + "']")!=-1)
return({"caption":p.caption,"scope":c.scope,"vsp":c.viewStatePath,"operator":p.operator});
}
}
}
}
return null;
}
SAutils.getColPromptInfo=function(formula){
collections= gDocPromptManager.getAllPromptCollectionJSON();
for(i=0;i<collections.length;i++){
c=collections[i];
for (j=0;j<c.promptSteps.length;j++){
pstep=c.promptSteps[j];
for (k=0;k<pstep.prompts.length;k++){
p=pstep.prompts[k];
if(p.promptType=="columnFilterPrompt"){
if (p.dataType.displayColumnFormula==formula)
return({"caption":p.caption,"formula":p.dataType.displayColumnFormula,"vsp":c.viewStatePath,"operator":p.operator});
}
}
}
}
return null;
}
SAutils.setColumnPrompt=function(formula,value){
g_str = "<sawx:expr xmlns:sawx='com.siebel.analytics.web/expression/v1.1' xsi:type='sawx:list' op='_OP_' emptyAsAllChoices='true' xmlns:xsi='http://www.w3.org/2001/XMLSchema-instance'><sawx:expr xsi:type='sawx:sqlExpression'>_COLFORMULA_</sawx:expr><sawx:expr xsi:type='xsd:string'>_VAL_</sawx:expr></sawx:expr>";
pInfo = this.getColPromptInfo(formula);
g_str = g_str.replace('_COLFORMULA_',pInfo.formula).replace('_VAL_',value).replace('_OP_',pInfo.operator);
g = this.getxmldoc(g_str);
PromptManager.submitPrompt(pInfo.vsp, true, "PromptFinish", g);
}
SAutils.setPSVarPrompt=function(varname,value){
g_str="<sawx:expr xmlns:sawx='com.siebel.analytics.web/expression/v1.1' setVariable=\"dashboard.variables['_VAR_']\" xsi:type='sawx:setVariable' op='in' emptyAsAllChoices='false' xmlns:xsi='http://www.w3.org/2001/XMLSchema-instance'><sawx:expr xsi:type='sawx:sqlExpression'/><sawx:expr xsi:type='sawx:untypedLiteral'>_VAL_</sawx:expr></sawx:expr>";
pInfo = this.getVarPromptInfo(varname);
g_str = g_str.replace('_VAR_',varname).replace('_VAL_',value);
if(pInfo.scope=='dashboardPage')
g_str = g_str.replace('dashboard.variables[','dashboard.currentPage.variables[');
g= this.getxmldoc(g_str);
PromptManager.submitPrompt(pInfo.vsp, true, "PromptFinish", g);
}
SAutils.setRequestVarPrompt=function(varname,value){
g_str="<sawx:expr xmlns:sawx='com.siebel.analytics.web/expression/v1.1' setVariable=\"requestVariables['_VAR_']\" xsi:type='sawx:setVariable' op='in' emptyAsAllChoices='false' xmlns:xsi='http://www.w3.org/2001/XMLSchema-instance'><sawx:expr xsi:type='sawx:sqlExpression'/><sawx:expr xsi:type='sawx:untypedLiteral'>_VAL_</sawx:expr></sawx:expr>";
pInfo = this.getVarPromptInfo(varname);
g= this.getxmldoc(g_str.replace('_VAR_',varname).replace('_VAL_',value));
PromptManager.submitPrompt(pInfo.vsp, true, "PromptFinish", g);
}
SAutils.subscribetoMDEvent=function(channel,functionhandle,sourceviewname){
var b = new obips.views.MaterDetailEventListener(channel, new obips.Callback(null, functionhandle));
b.viewID= sourceviewname;
obips.views.ViewController.getController("viewid").addEventListener(b);
}
SAutils.publishMDEvent=function(channel,values){
var g_values="";
for (i =0; i< values.length; i= i +2){
var col = values[i].replace(/"/g,'%22').replace(/ /g,'%20');
var val = values[i+1].replace(/"/g,'%22').replace(/ /g,'%20');
var g = '{"_g": {"'+ col +'": ["' + val + '"]}}';
g_values += g + ",";
}
if (g_values.length> 0)
g_values = g_values.substring(0,g_values.length-1);
o='{"_m":['+ g_values +']}';
var r = new obips.views.MasterDetailEvent("viewid", o);
obips.views.ViewController.getController(r.sourceViewID).postClientEvent(channel, r);
}
/* End SAutils JS Library*/
function setupPOIStyles(layer){
var circles = [];
for(var i=0; i<10; i++)
{
circles[i] = new OM.style.Marker({
name:"circle_"+i,
vectorDef : [{
shape: { type:"circle", cx:5, cy:5, width:5, height:5 },
style: {
fill:"#AFB6BD",
stroke:"#6784A3"
}
}],
width: 7 + i*3,
height:7 + i*3
});
highlights[i] = new OM.style.Marker({
name:"highlight_"+i,
vectorDef : [{
shape: { type:"circle", cx:5, cy:5, width:5, height:5 },
style: {
fill:"#FFFF44",
stroke:"#6784A3"
}
}],
width: 7 + i*3,
height:7 + i*3
});
}
var bucketStyle = new OM.style.BucketStyle(
{
styles: circles,
numClasses:10,
classification:'equal', //creates equal-ranged buckets
defaultStyle: highlights[0]
});
layer.setRenderingStyle(bucketStyle, ["REVENUE"]);
}
function clearHighlight(e)
{
if (highlightLayer != null)
{
map.removeLayer(highlightLayer);
highlightLayer = null;
document.getElementById('selectedpois').innerHTML = "";
}
}
function addHighlight(e)
{
clearHighlight();
var tool = e.target;
var geom = tool.getGeometry();
//to select all the features that interact with a custom drawn geometry
//(using the circle, rectangle or polygon tool), we simply apply the
//AnyInteract filter on all the current layer.
var filter1 = new OM.filter.AnyInteract(geom);
var selectStyle = new OM.style.Color({ fill:"#ffff44", stroke:"#44ff22" });
//The result of applying the filter is returned as a new layer.
highlightLayer = poiLayer.applyFilter(filter1,false);
var features=highlightLayer.getAllFeatures();
var selStr = "", selStr1 = "";
var hlayerStyle = poiLayer.getRenderingStyle();
hlayerStyle = hlayerStyle.clone();
hlayerStyle.styles = highlights;
highlightLayer.setRenderingStyle(hlayerStyle);
for(i=0;i<features.length;i++){
selStr += features[i].getAttributeValue("_LABEL_") + "<br/>";
selStr1+="'"+features[i].id + "',";
}
document.getElementById('selectedpois').innerHTML = selStr;
//following is used to set dashboard variable prompt
if(selStr1.length>2){
selStr1 = selStr1.substring(0,selStr1.length-1);
SAutils.setPSVarPrompt('poi_selection',selStr1);
}
map.addLayer(highlightLayer);
}
function renderMap(repData){
if (currMapData == repData) return;
currMapData = repData;
var darray=eval('['+repData+']');
var baseURL = "http://"+document.location.host+"/mapviewer";
var center = new OM.geometry.Point(80.629999525845,6.24835010014457,4326);
map = new OM.Map(document.getElementById('map'),{mapviewerURL: baseURL}) ;
//var tilelayer = new OM.layer.ElocationTileLayer("oracle.maps");
//map.addLayer(tilelayer) ;
// Add a map tile layer as background.
var tileLayer = new OM.layer.GoogleTileLayer(
"baseMap",
{
mapTypeList:"OM.layer.GoogleTileLayer.TYPE_ROAD;OM.layer.GoogleTileLayer.TYPE_SATELLITE; OM.layer.GoogleTileLayer.TYPE_SHADED",
mapTypeVisible:true,
libURL:"http://maps.google.com/maps?file=api&v=2&sensor=false",
key:"AIzaSyBE41hAK-vPtlKpFAIZlTG2euvikcml1xw"
});
map.addLayer(tileLayer);
poiLayer = new OM.layer.VectorLayer("pois", { def:{ type:OM.layer.VectorLayer.TYPE_LOCAL } });
/*"Retailer Name","Retailer ID","Province","Lat","Long","Revenue","Avg Revenue"*/
for (i=0;i<darray.length; i++){
var fid = darray[i][0];
var mpoint = new OM.geometry.Point(darray[i][6], darray[i][5],4326);
var f_attr = {attributes :{"_LABEL_":darray[i][0], "RETAILER ID":darray[i][1], "PROVINCE":darray[i][2], "DISTRICT":darray[i][3], "DIVISION":darray[i][4], "REVENUE":darray[i][5]+"", "AVG REVENUE":darray[i][6]+""}};
var feature = new OM.Feature(fid,mpoint,f_attr);
poiLayer.addFeature(feature);
}
poiLayer.setBringToTopOnMouseOver(true);
setupPOIStyles(poiLayer);
map.addLayer(poiLayer) ;
map.setMapCenter( center );
map.setMapZoomLevel(9) ;
var navigationPanelBar = new OM.control.NavigationPanelBar( {style:2 } );
map.addMapDecoration(navigationPanelBar);
toolbar = new OM.control.ToolBar("toolbar1",{ builtInButtons:[OM.control.ToolBar.BUILTIN_ALL] });
toolbar.setPosition(0.4,0.05);
map.addToolBar(toolbar);
var circleTool = toolbar.getBuiltInTool(OM.control.ToolBar.BUILTIN_CIRCLE);
circleTool.on(OM.event.ToolEvent.TOOL_END, addHighlight);
circleTool.on(OM.event.ToolEvent.TOOL_CLEAR, clearHighlight);
var rectTool = toolbar.getBuiltInTool(OM.control.ToolBar.BUILTIN_RECTANGLE);
rectTool.on(OM.event.ToolEvent.TOOL_END, addHighlight);
rectTool.on(OM.event.ToolEvent.TOOL_CLEAR, clearHighlight)
var polyTool = toolbar.getBuiltInTool(OM.control.ToolBar.BUILTIN_REDLINE);
polyTool.on(OM.event.ToolEvent.TOOL_END, addHighlight);
polyTool.on(OM.event.ToolEvent.TOOL_CLEAR, clearHighlight);
polyTool.on(OM.event.ToolEvent.REDLINE_EDITED, addHighlight);
var copyright = new OM.control.CopyRight({
anchorPosition:4,
textValue:"Google Maps data HERE",
fontSize:9,
fontFamily:"Arial",
fontColor:"black"
});
map.addMapDecoration(copyright);
map.init() ;
}
</script>
This video shows some very good examples of using these API for some really interesting analytics.
You can get some more examples of using the MapViewer API from the oracle mapviewer blog. Also
Related blogs


