Thanks to credit cards and banks, we live in a world where we can enjoy experiences beyond our financial reach even before we are able to afford them. Credit card companies have amassed massive wealth from issuing credit cards, and so have banks who provide the financial liquidity that enables us to enjoy the experience. However, in order to limit delinquencies and reduce default rates on payments, companies need to level up on their game.
This is where smart analytics solutions take the stage. The ability to review data from credit card usage by cardholders is an almighty formula for managing the debt crisis facing the industry. With that, banks will be able to better manage their liquidity and drastically reduce the prevalence of poor facilities by analyzing data pulled from cardholders’ payment history.
Here at Just Analytics, we specifically designed a credit card analysis reporting system that can help businesses such as banks and fintech firms to better organize their periodic reports in a way that allows them to easily access customer credit data.

The unique features of the reporting systems provided by Just Analytics are highlighted below:
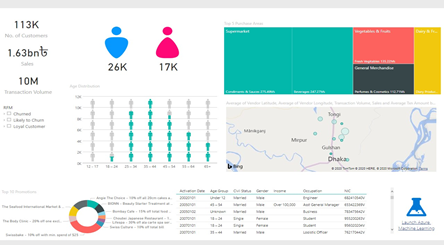
While the dashboard allows users to analyze and review all data simultaneously, it also allows users to drill down more specifically into each consumer’s history. This kind of review is essential when making a decision on the customer’s credit application, as it provides insight into the individual's spending habits, payment history, and earnings. Your organization will be able to view who is keeping up with payment deadlines and who is likely to default.
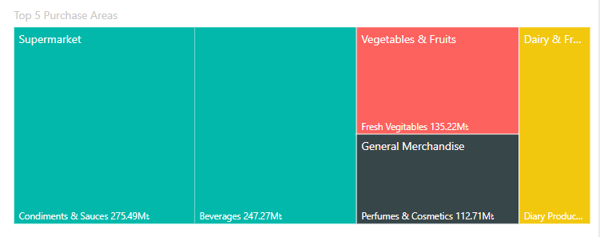
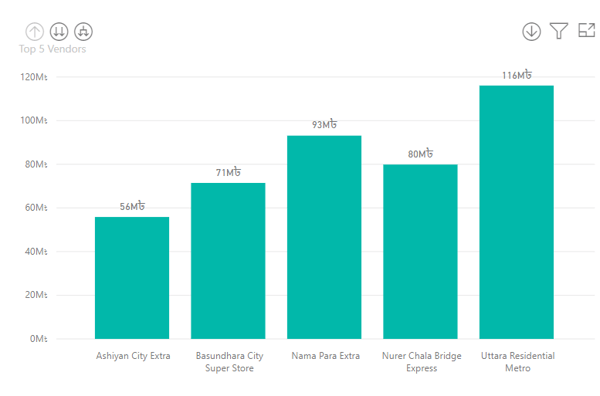
With an individual review of the cardholder’s spends, your firm will know which categories they are putting their money in. Are they spending more on alcohol? Or food? Or travels? With that, you will be able to better target them with advertisements promoting spends in these categories. Additionally, your firm will see which vendors your customers are frequenting, thereby also giving you the opportunity to partner with these vendors to encourage even more spends.


3. Visualization at a Glance
Without having to look at long rows and columns of consumer data, organizations can easily pick out relevant information from the reports to facilitate decision-making. Each dashboard is interactive and can be easily manipulated. A simple analysis of data collated over time on customers' spending habits will provide an insight into which segment or category the highest.
Have we piqued your interest? Do contact us for a complimentary demo to showcase what insights can be delivered to meet your organisation’s goals and objectives.


