According to The Deloitte Global Chief Procurement Officer Survey 2019, one of the top two “strong priorities” for business strategies over the next 12 months is the “perennial concern of costs reduction”. In order to identify cost saving opportunities, monitor supplier relationship and operational efficiency, companies would have to actively engage in spend analysis practices to improve their corporate spend thereby increasing profits.
While it is often easy for companies to then cut to the chase and immediately slash “unnecessary” costs, one has to ask what are these unnecessary costs, how does one define unnecessary? A thorough analysis is therefore required to find out exactly where money is being spent. This will answer important questions like the who, what, where, when, why and how with regards to spends and suppliers and other important indicators.
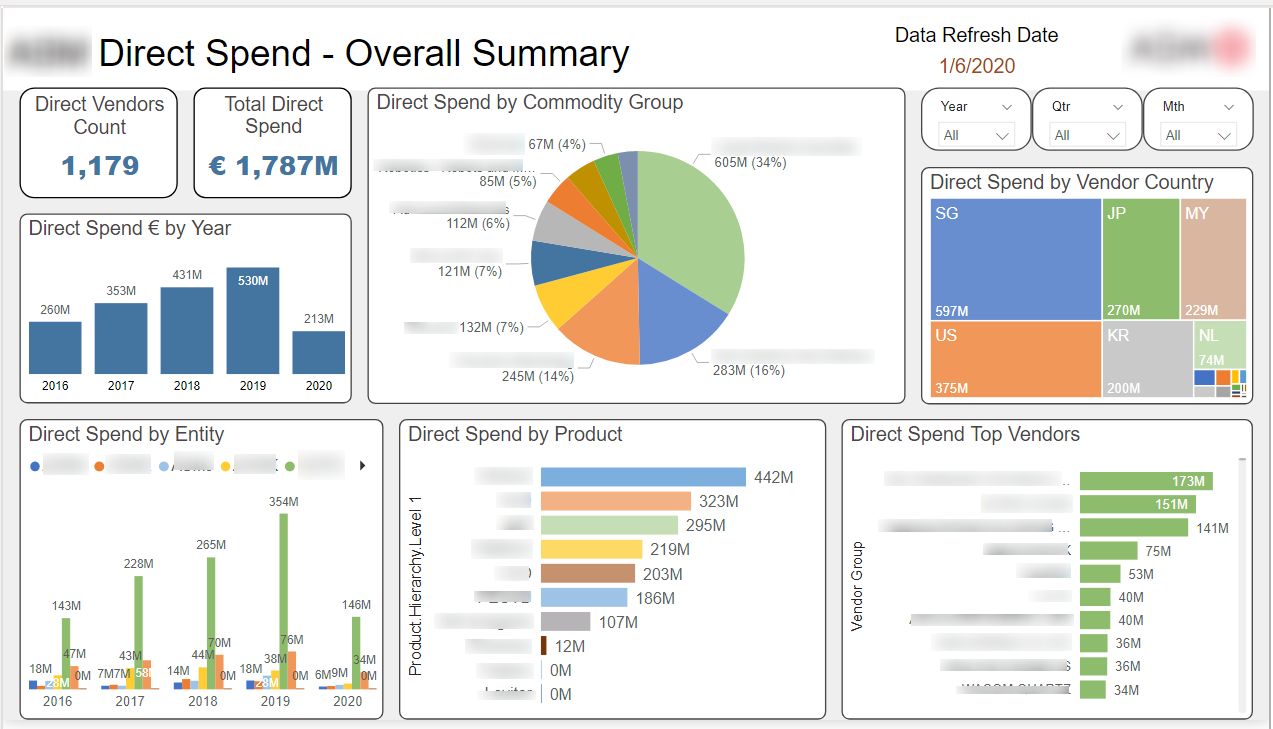
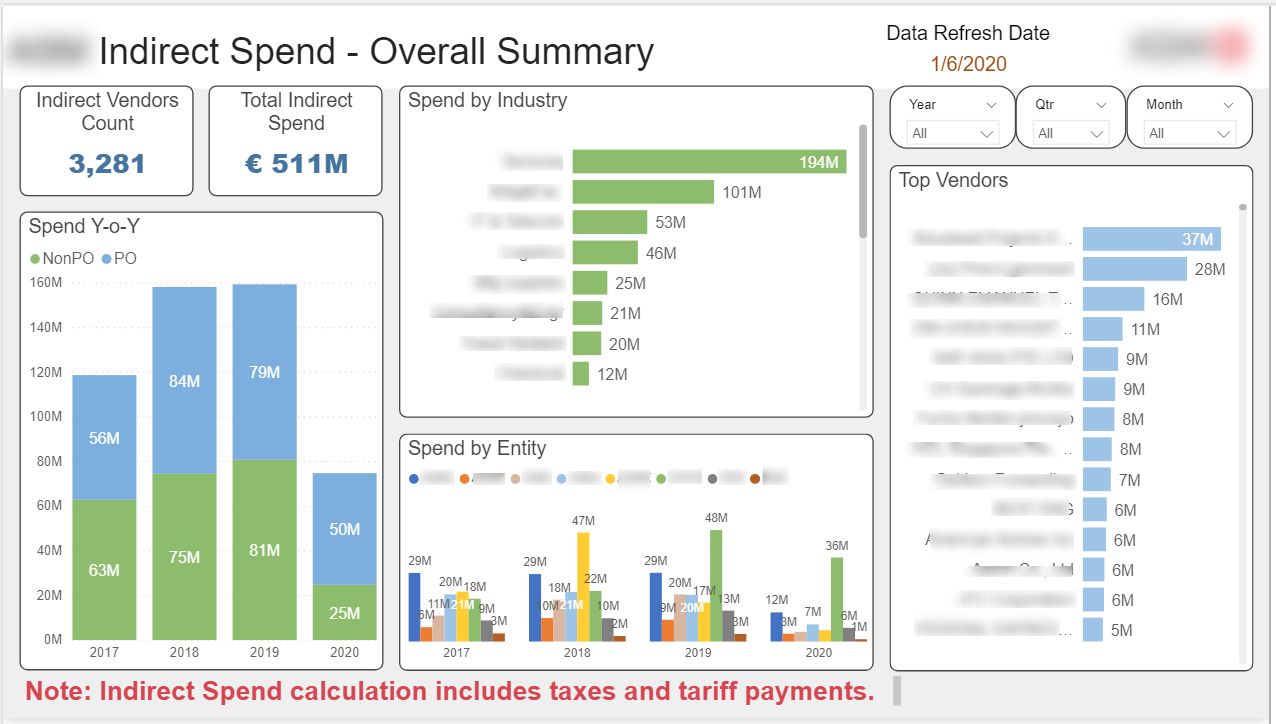
At Just Analytics, we have built a Spends Analytics Reporting System that can assist companies in keeping track of their spends – direct and indirect spends, spends by commodity, product and vendor. With this reporting system, you have the ability to drilldown to material spends by commodity group, vendor and time period. This level of detail allows you to make the best decisions for your company, attaining your business goals and objectives.
Some key features this report can provide:
1. Full transparency of spends
With a proper organisation of your company’s spends, it will offer greater transparency into the amount of spends that is going out of the company’s pockets, and what is the core of the expenses and purchases. The data needed for spend analysis is often ingested from multiple data sources in an organisation, this makes for a lot of duplication, cleansing and classification of data that probably needs to be conducted before performing any form of analysis. While spend analysis gives rise to a more effective manner to collate, store and manage vast amounts of company data, it also enables top management to formulate initiatives and make confident spending decisions.


2. Full visualisation of data
The benefit of using a visualisation tool to carry out your reporting is that the data is no longer presented to you in rows of numbers or in just plain numbers. As our human brain is wired to better interpret visuals, we are better able pick out patterns from just one look at it. Imagine what we can do with the right visuals and information!
The resulting data will show patterns and trends in your organisation’s spends. Top management will be more equipped to identify potential savings in some categories. With that, you might be able to cut costs through purchasing alternative products, supplier consolidation or bulk buying of different products. While old but still a highly relevant tip, Harvard Business Review suggests to forget about finding one single solution that would radically solve your costing issue, but instead advises to find several small actions that would incrementally add up to hit your costing goal. A visualisation of the data will allow you to pick out nuances in data thereby leading to possible cost reduction.
Have we piqued your interest? Contact us for a complimentary demo to showcase what insights can be delivered to achieve your business goals and objectives.


