"Having an effective inventory management, it really is at the core of supply chain and that is making sure that you've got the right product at the right price with the right consumer at the right place," Abe Eshkenazi, CEO of ASCM (Association for Supply Chain Management) told Supply Chain Dive in an interview in June 2020.
That said, achieving an efficient supply chain should not be the end goal of any organisation. Rather, it should be customer satisfaction – as that ensures long term profits. But even that should not stop there. From that same article, 58% of the surveyed supply chain professionals in the US had listed inventory management as the top technical skill. The Fill Rate Reporting System engineered by Just Analytics is a vital tool that all in supply chain would reap the benefits of using it – by supplementing you with the information necessary for efficient inventory management. Allowing you to make good judgement calls and good decisions.
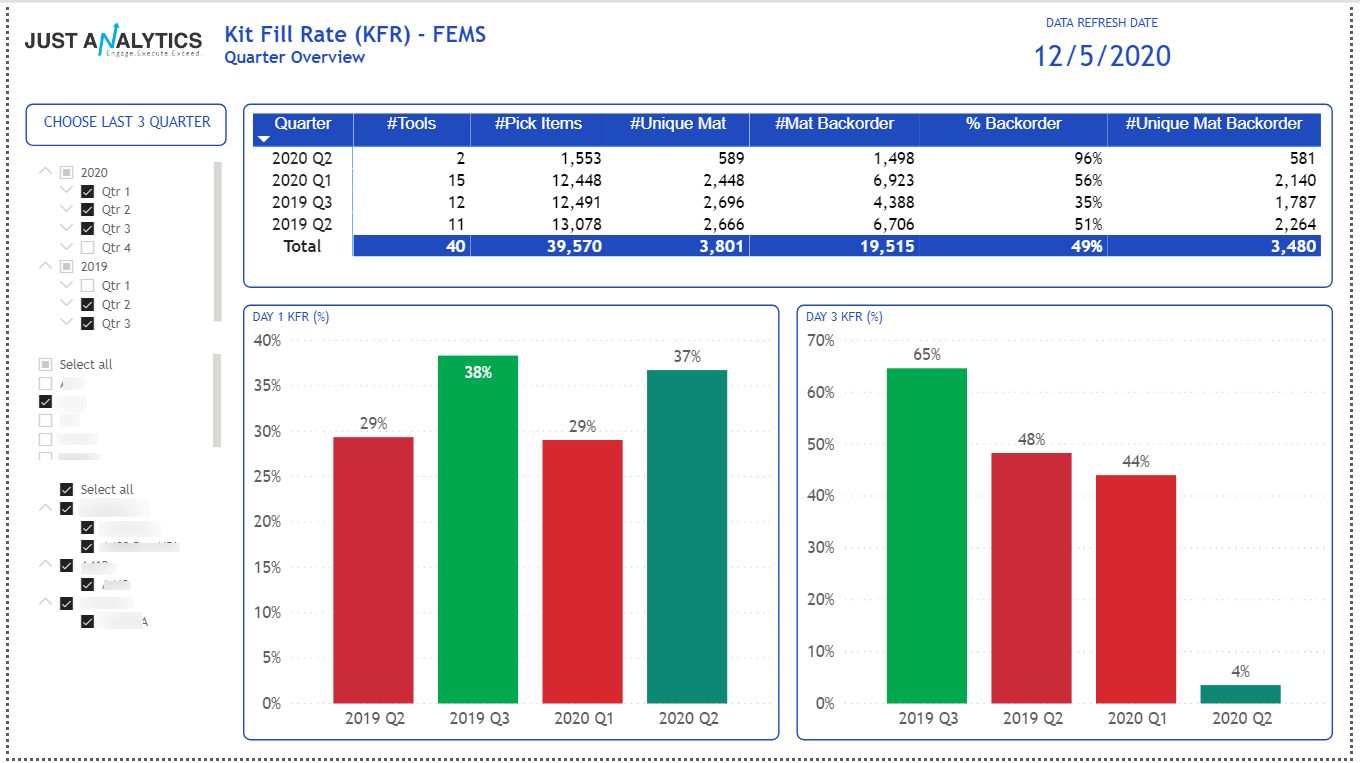
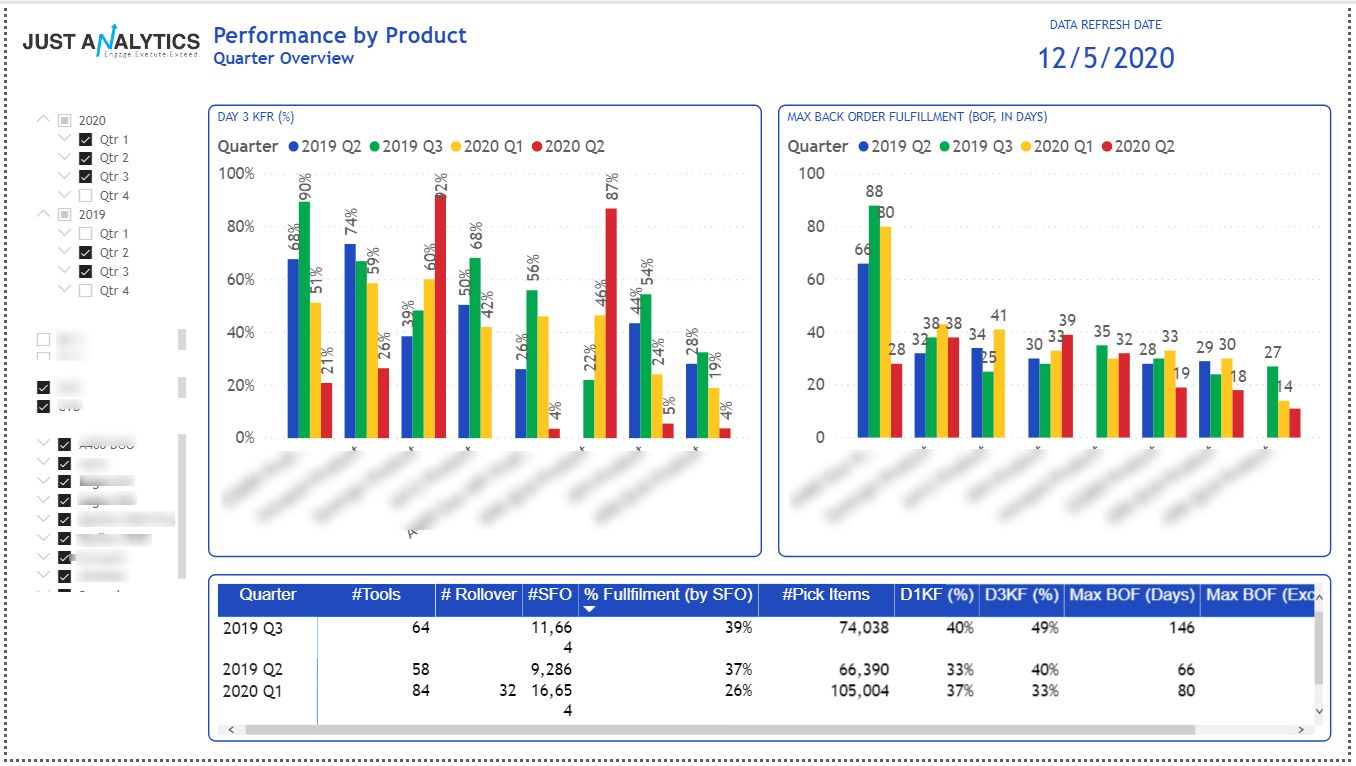
This reporting system is intuitive and easy to manoeuvre. It utilises visuals (see below) to convey information, enabling you to view important operational KPI’s that have been summarised such as the fill rate, backorder rate and pick items. All with the possibility of filtering by product line, time period client, vendor and many more.

Some of the unique features of this report is listed below:
1. Real-time data
Time is money. With Power BI, your business gets to save precious time by doing away with the daily manual updating. This report template receives data in real-time from devices and sources of data such as factory sensors, service usage metrics, or many other time-sensitive data collectors or transmitters. Data can be loaded either on a batch or on a real-time basis. Getting real-time data promotes higher accuracy in data recording, greater efficiency is achieved as the mundane and time-consuming tasks are left to the machines to do.
2. Forecasting
With historical data being recorded in a systematic, consistent and organized manner, your business will be able to carry out more accurate inventory forecasting. One of the metrics in inventory management is Fill Order Rate, which is the percentage of customer demand is that met by stock that is currently in the warehouse. When data such as Fill Order Rate for various products is explicitly laid out side by side against time periods, you will be able to get an overall sense of the demand of the product line. Businesses should maintain a comfortable Fill Order Rate of between 85-95%.
3. Full customization
One important and sometimes overlooked metric in inventory management is the Pareto Analysis. Also known by the 80-20 rule, where 80% of output is determined by 20% of the inputs. The Pareto charts helps you to direct and concentrate efforts on products and clients that can contribute to the biggest impact on profits. A Pareto chart can help to reveal parts which can have the most improvements once efforts are being diverted there.

That said, with the capability of customization, you will be able to input important metrics that can churn out the right information for you.
Hope we have piqued your interest. Do contact us https://www.justanalytics.com/contact-us for a complimentary demo to showcase what insights can be delivered to meet your organisation’s goals and objectives.


