All companies aim to provide quality products and services to their customers. Quality is a mindset and an approach adopted by companies to increase customer satisfaction and sustain profit in the long run. Companies achieve this by engaging in quality management, which is the practice of overseeing the tasks and activities in an organisation to ensure that they meet a desired level of excellence.
Quality indicators are typically used to measure and monitor a company’s performance. In the manufacturing industry, but not limited to, KPIs help to identify the possible areas of inefficiency that should be avoided, giving leeway for greater productivity. For example, if the cycle time KPI constantly is not met, then this is a glaring indicator that something in the production cycle is holding back your operations. Consequently, this could have contributed to higher costs.

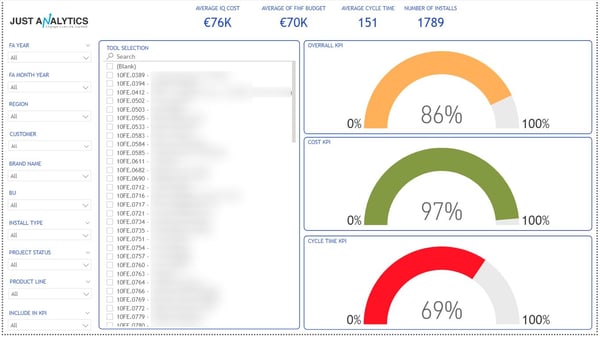
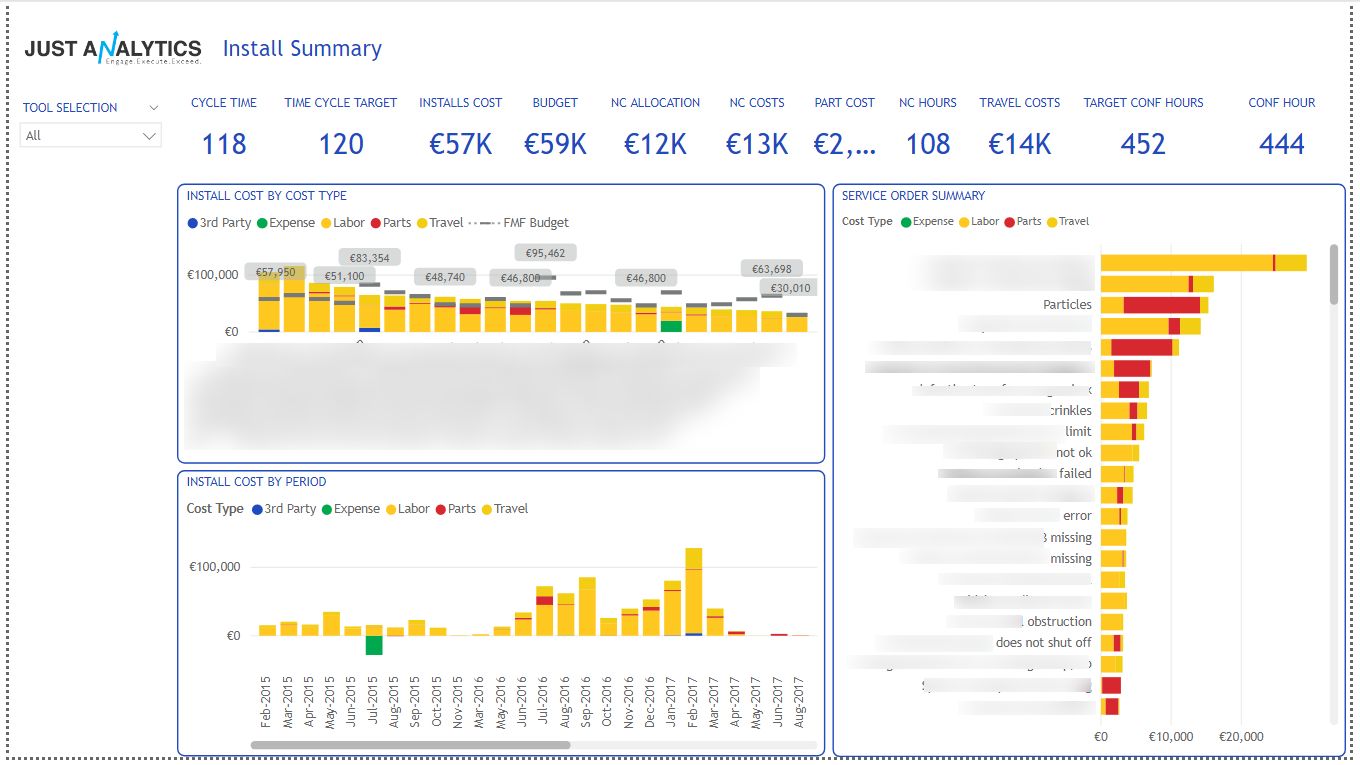
Just Analytics has built this Installation and Quality Management Reporting System that can support companies in providing exceptional customer service. This reporting system is intuitive and easy to manoeuvre. It utilises visuals (see below) to convey information, enabling you to view important operational KPIs such as the cost KPI, cycle time KPI as well as a breakdown of the installation of the equipment by cost type, service order or time period.

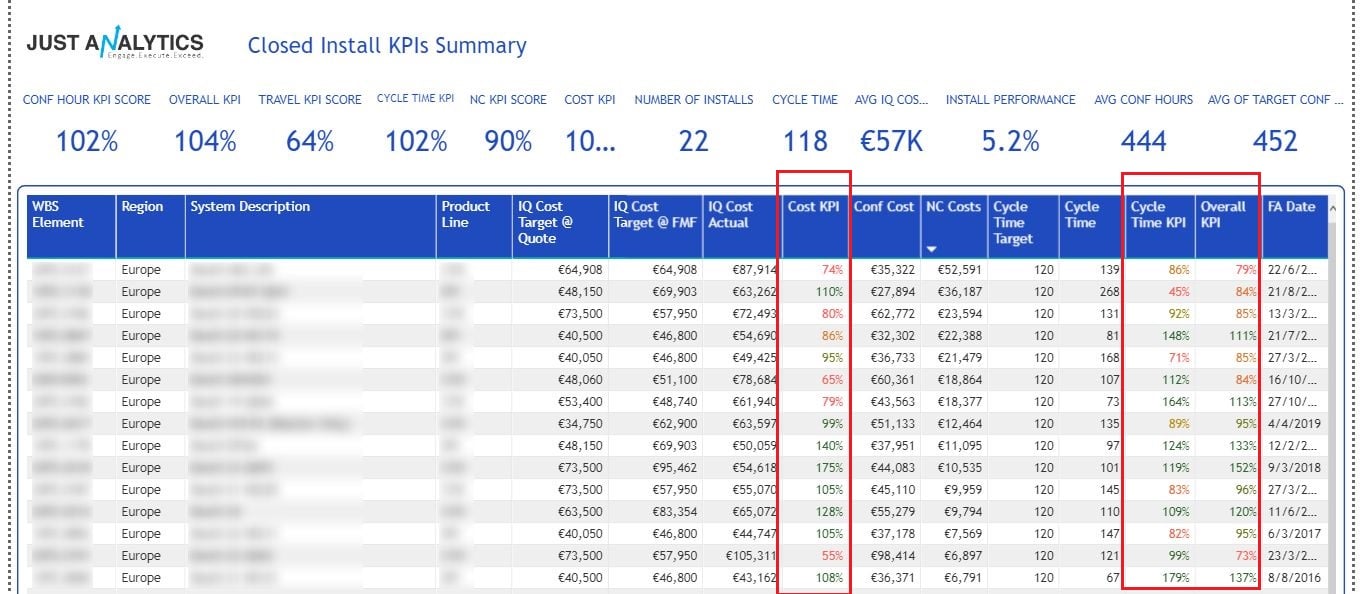
It is important to have an organised system to track your KPI’s in a way that is easy to access because this helps to facilitate your decision making. The KPI’s are colour coded (see below) in relation to performance thereby providing your organisation an immediate overview of KPI’s that urgently need attention.

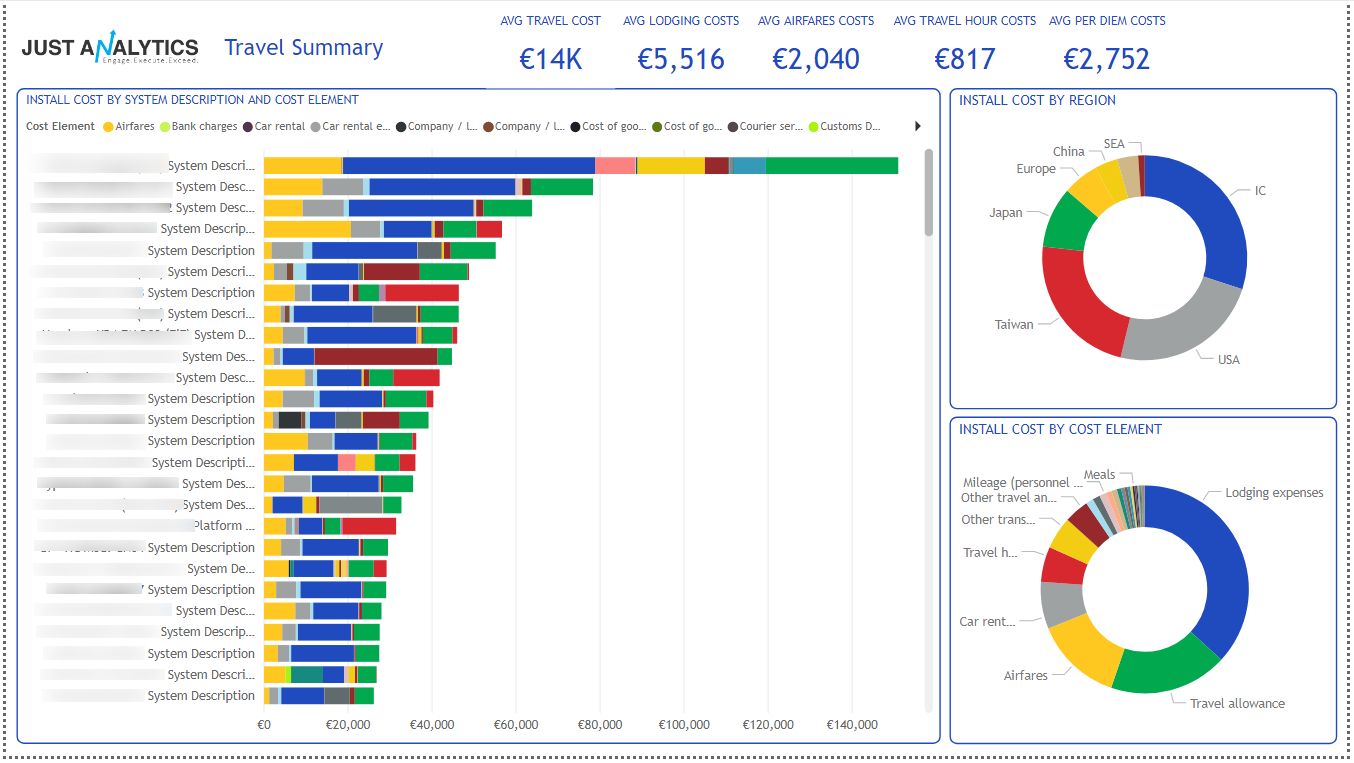
The data is easy to interpret with numbers being translated into a whole host of data visualisation diagrams. Depending on the context of the data, this report presents your numbers via the use of bar graphs, pie-charts and many more. We understand that too much data can get overwhelming, and our fast-paced world just does not give us the luxury of taking our time to interpret data. Thus, values are also colour coded (see below) so that you will be able to assess the proportion of spends with just one look at it and be able to make decisions quickly and effectively.

Quality should not end when a particular goal has been achieved. Rather, it is a continuous race to growth with no destination.
Interested to find out more? Contact us for a complimentary demo to find out how we can better enable your organisation to meet your goals and objectives.


