For as long as the supply and demand chain has existed, organizations have always been on the lookout for strategic ways to grow their business. Pricing and sales, for instance, are two focuses popular for their direct and striking impact on profit. However, for 78% of procurement leaders surveyed in The Deloitte Global Chief Procurement Officer Survey 2018, cost reduction is their top priority strategy.
With cost reduction in mind, this naturally bleeds into the different methods organizations utilize to meet well-established business goals. A different survey by Deloitte demonstrates a common perspective that places a high value on data analytics, with CPOs taking proactive approaches to optimize procurement by adopting various technologies.
Still, even with the value technologies add to the process, surveyed CPOs reveal that they are not satisfied, citing poor master data quality, standardization, governance as well as the inability to gain analytics and insights from the systems as their main challenge. This then demands for analytics that is designed with better data quality for greater visibility. Here at Just Analytics, we check these boxes through our Cost-Savings Reporting System:
1. Quality data, now visualized and fully accessible
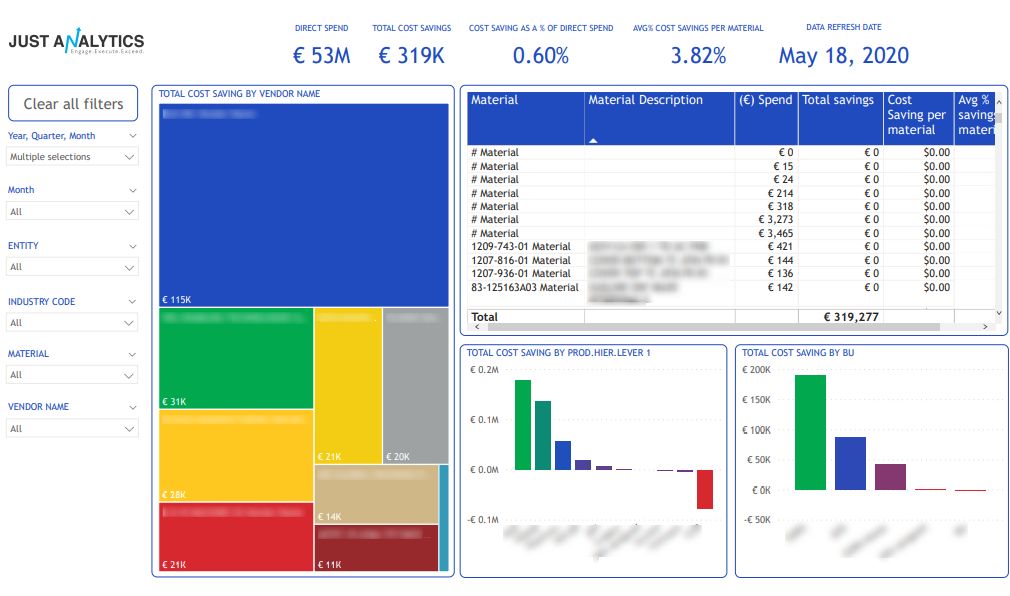
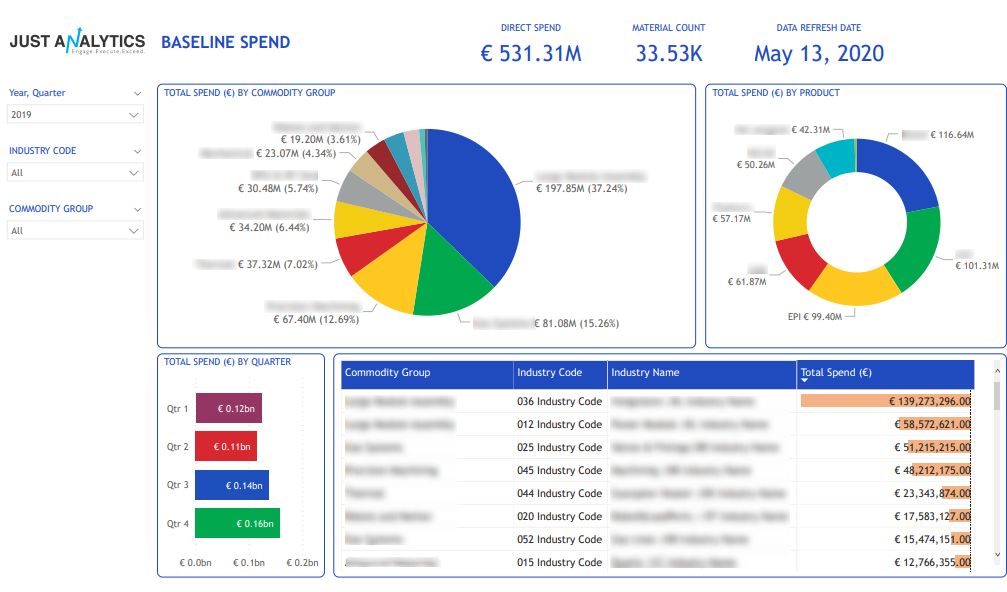
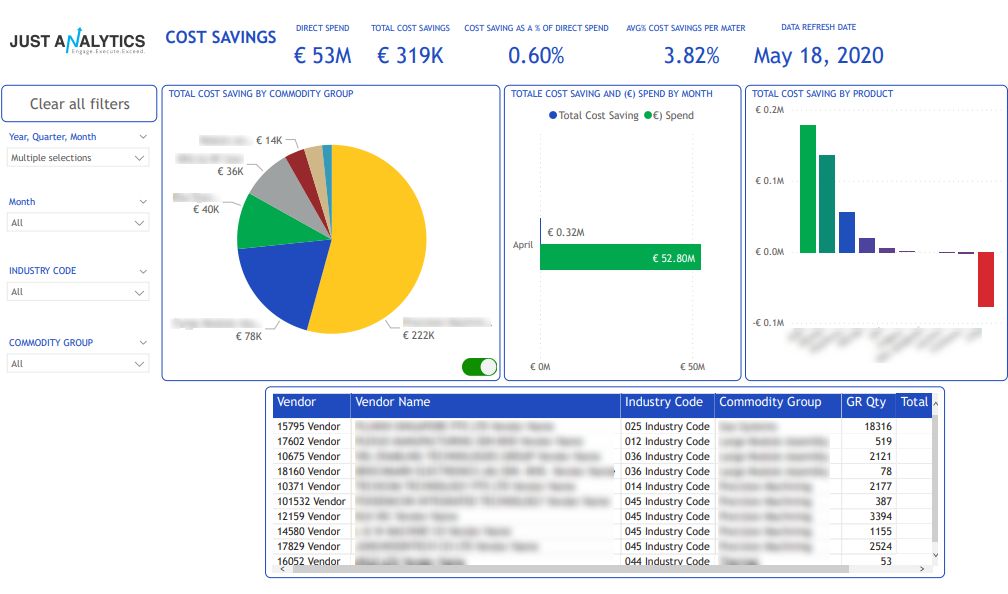
If your organization has been collecting a generous amount of data, you are on the right track. However, even potentially valuable data means nothing when it is incomprehensible. This is why our dashboard is structured in a way that prioritizes straightforward visualization over jumbled data.

Data such as total spends, commodity group, materials, vendors, and more will be pre-standardized and recorded into their respective categories. Through these categories, cost savings will be identified and calculated, then compared with other different categories and visualized as relevant metrics and KPIs. The output is an easy-to-grasp dashboard with clean-looking charts, detailing a relevant overview of where you are reducing cost.
2. Traceable data enables better reporting
With great visibility, comes greater reporting. Especially for Finance, a well-organized and easy-to-track report such as this one is vital in cutting down considerable hours spent on consolidating piles of different reports. With comprehensive filters and clearly defined entities centralized into one cost-savings report, data tracking through months, quarters, and years becomes much easier. Budgeting becomes less of a hassle and more time can be allocated on optimizing financial strategy. In no time, organizations will be procuring strategically, saving cost that is visible in the income statement, but without sacrificing the quality you offer.

3. Comprehensive report for strategic decision-making

Everything you see on your dashboard carries very useful tooltips with them. This feature alone will allow you to gain details on specific areas of interest and understand their respective connections without taking them away from the context they exist within. If you want to further contextualize this report, a drill-through feature will bring you to other relevant reports, making both the details and the big picture accessible at the tip of your cursor. With these features and all the quality data accumulated over time, analytics will certainly be a powerful record for numerous strategic cross-organizational decision-making, such as in:
• Identifying savings opportunities.
• Streamlining procurement process.
• Eliminating maverick spending.
• Verifying and increasing compliance.
• Managing risk.
• Monitoring and optimizing relationship with suppliers.
Bottom line, by providing quality data that generates useful analytics and elevates data governance, your team will spend less time on drowning in a sea of numbers and more time on carrying out other strategies. In the long run, investing in cost-savings analytics can affect the organization’s overall profitability.
Do get in touch with us for a complimentary demo to showcase how you can turn your data into valuable insights.


